



Performance is not a switch in next.config. It is the result of architecture, data access, browser work, asset delivery, hosting, and real user conditions. The useful workflow is always the same: establish a baseline, locate the bottleneck, understand its cause, change one meaningful constraint, and measure again.
This guide applies that workflow to Next.js 16 App Router projects. It covers Core Web Vitals, Server and Client Components, request waterfalls, streaming, caching, code splitting, images, fonts, scripts, bundle analysis, database work, production testing, and a practical dashboard optimization.
Performance Optimization Is a Measurement Loop
A Lighthouse report is evidence, not a to-do list. Run a production build, test representative routes under controlled conditions, inspect the network and performance traces, and compare those lab findings with field data. A fast local development navigation does not represent a cold mobile visit; development instrumentation and compilation also distort results.
The downloadable starter contains a minimal App Router page and layout. Its dependencies use latest, and there is no lockfile, exact Next.js patch, next.config, loading boundary, client boundary, dynamic import, image/font/script component, cache configuration, instrumentation, analytics, or bundle analyzer. This guide therefore demonstrates current patterns without claiming the starter already uses them.
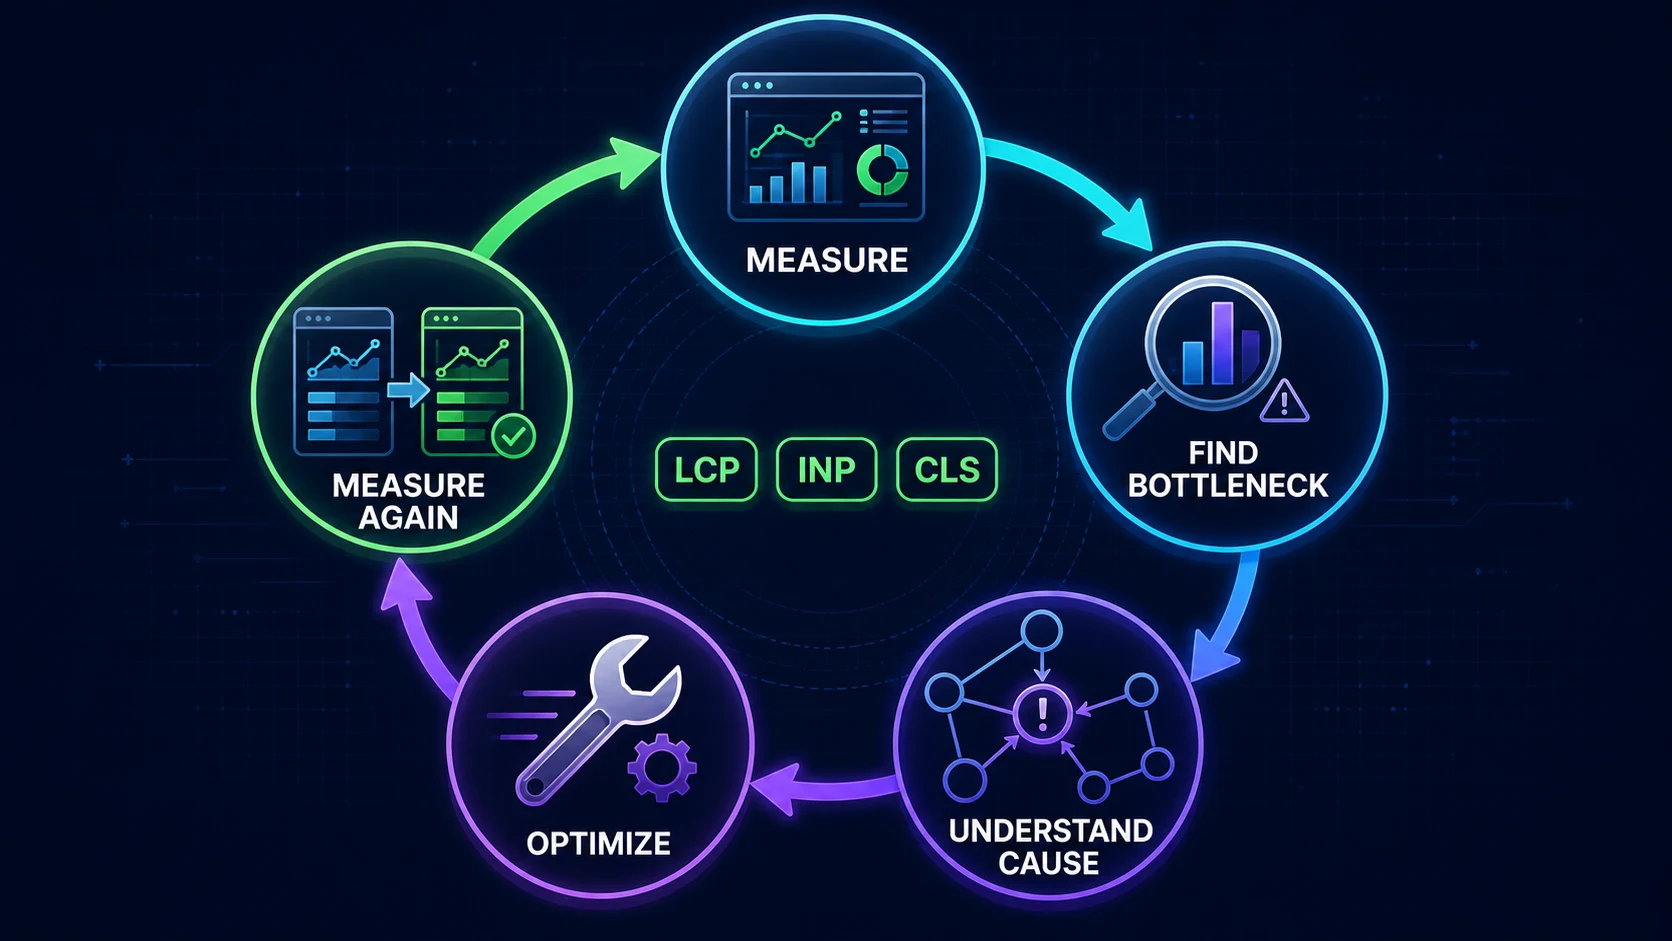
- Baseline
- Trace route
- Find constraint
- Change cause
- Verify
Core Web Vitals: LCP, INP, and CLS
Largest Contentful Paint (LCP) describes how quickly the main visible content appears. Its cause may be server response time, a render-blocking resource, an undiscovered hero image, or client-side rendering. Interaction to Next Paint (INP) reflects responsiveness across user interactions; large JavaScript tasks, expensive renders, and third-party code are common causes. Cumulative Layout Shift (CLS) captures unexpected movement, often caused by media without dimensions, late fonts, injected banners, or unstable placeholders.
Diagnose the metric, not just the score. Lighthouse is valuable for repeatable lab investigation, but real-user monitoring shows the distribution across actual devices, caches, networks, and sessions. Segment by route and device class. An aggregate can hide one slow checkout or dashboard route.
Investigate the limiting event
For LCP, identify the actual LCP element in the trace. If it is text, investigate response time, font delivery, and render-blocking CSS. If it is an image, check when the browser discovers it, its transfer size, responsive source selection, and whether client rendering delays the markup. Improving an unrelated logo cannot fix a slow hero.
For INP, record a slow interaction and inspect the input delay, event-handler work, and presentation delay separately. Break long synchronous work into smaller tasks, avoid rerendering an entire client tree for a local state change, virtualize genuinely large lists, and move nonvisual computation off the critical interaction path. A dynamically imported library reduces initial cost but can still block the click that first loads and executes it, so measure that first-use experience too.
For CLS, use the layout-shift entries to find the element that moved and the element that caused it. Reserve media and ad space, keep skeleton and final component dimensions compatible, avoid inserting consent or notification UI above existing content, and verify font fallback metrics. Do not suppress useful interface updates merely to reduce a metric; make their placement predictable.
'use client'
import { useReportWebVitals } from 'next/web-vitals'

export function WebVitals() {
  useReportWebVitals((metric) => {
    // Send metric.name, metric.value and route context
    // to your approved analytics endpoint.
  })
  return null
}
Keep the Rendering Tree Server First
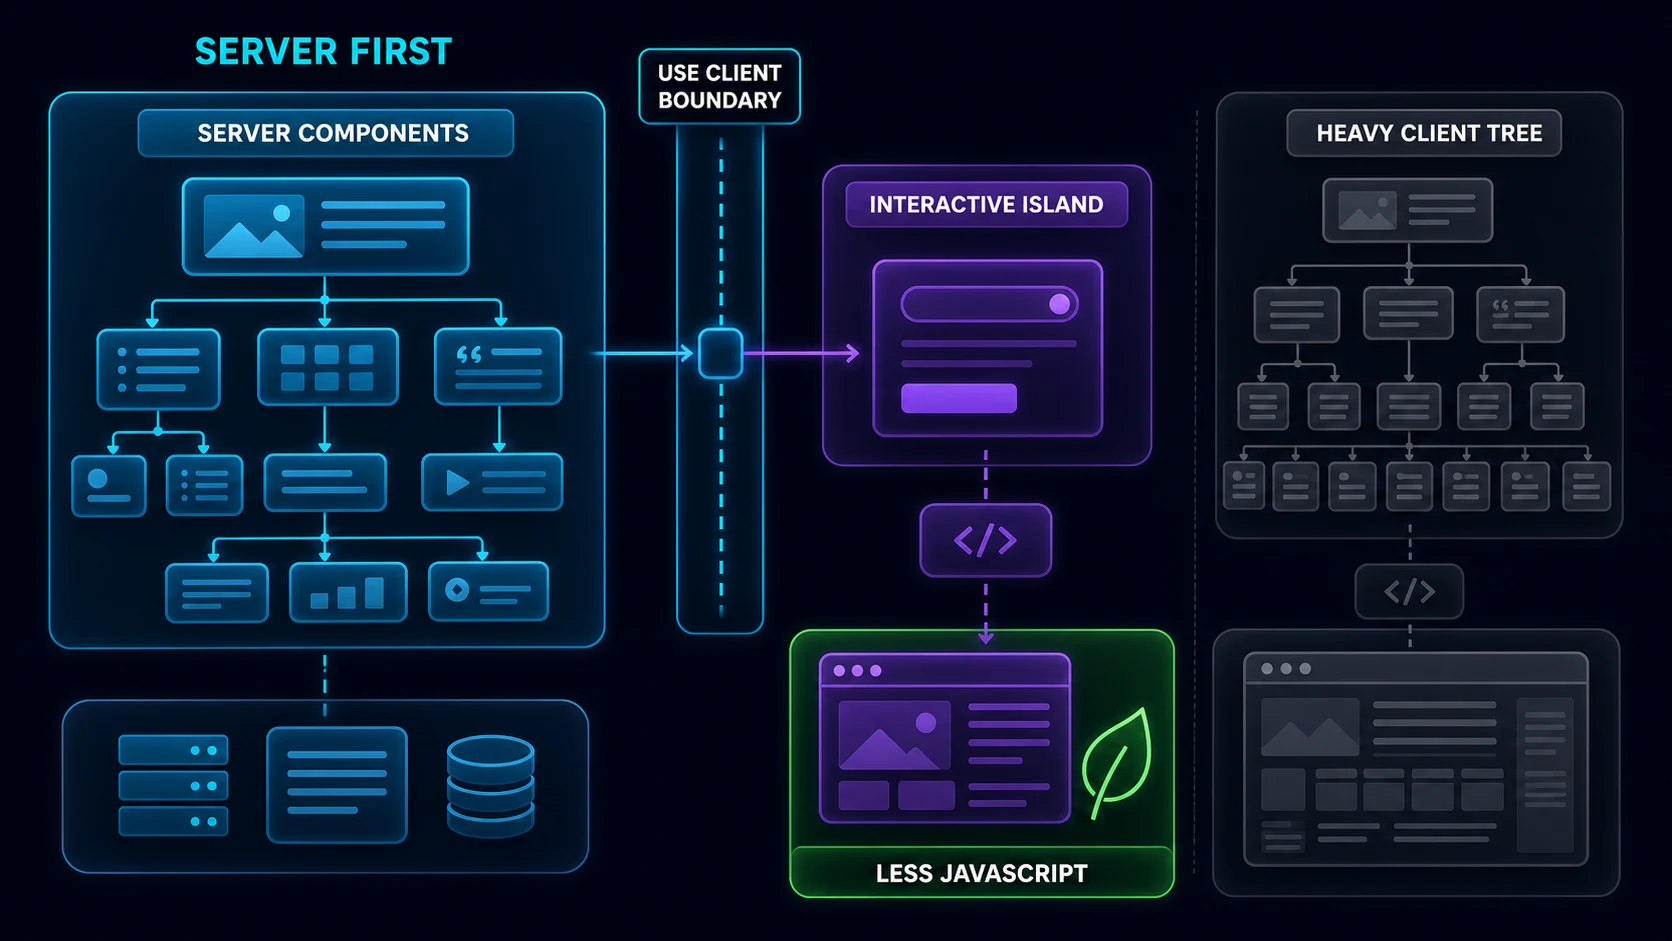
Server Components are the App Router default. Their component code is not sent to the browser, they can read server-side data directly, and they keep credentials and large dependencies out of the client bundle. Use Client Components only where the browser must own state, effects, event handlers, or browser APIs.
The 'use client' directive defines a boundary. The module and the modules it imports become part of the client graph, so putting it on a route layout can pull far more JavaScript into every child route than intended. Move interactivity into a leaf such as a filter, menu, chart control, or dialog trigger. A Server Component can render that leaf and pass serializable, minimal props.
Code Splitting and Lazy Loading
Server Components are automatically code split. For heavy Client Components that are not required for the first view, use next/dynamic. The framework combines React lazy loading and Suspense behavior. A chart below the fold, rich editor behind an “Edit” button, or large modal is a better candidate than the primary heading or purchase control.
'use client'
import dynamic from 'next/dynamic'

const RevenueChart = dynamic(() => import('./revenue-chart'), {
  loading: () => <div className="chart-skeleton" aria-label="Loading chart" />,
})

export function AnalyticsPanel() {
  return <RevenueChart />
}
Use ssr: false only inside a Client Component and only for code that truly requires the browser. For an optional external library, import it inside the user event that needs it. This avoids charging every visitor for functionality they never open. Dynamic importing a Server Component does not lazy-load that Server Component itself; it can help with child Client Components, so verify the resulting chunks.
Remove Data Waterfalls
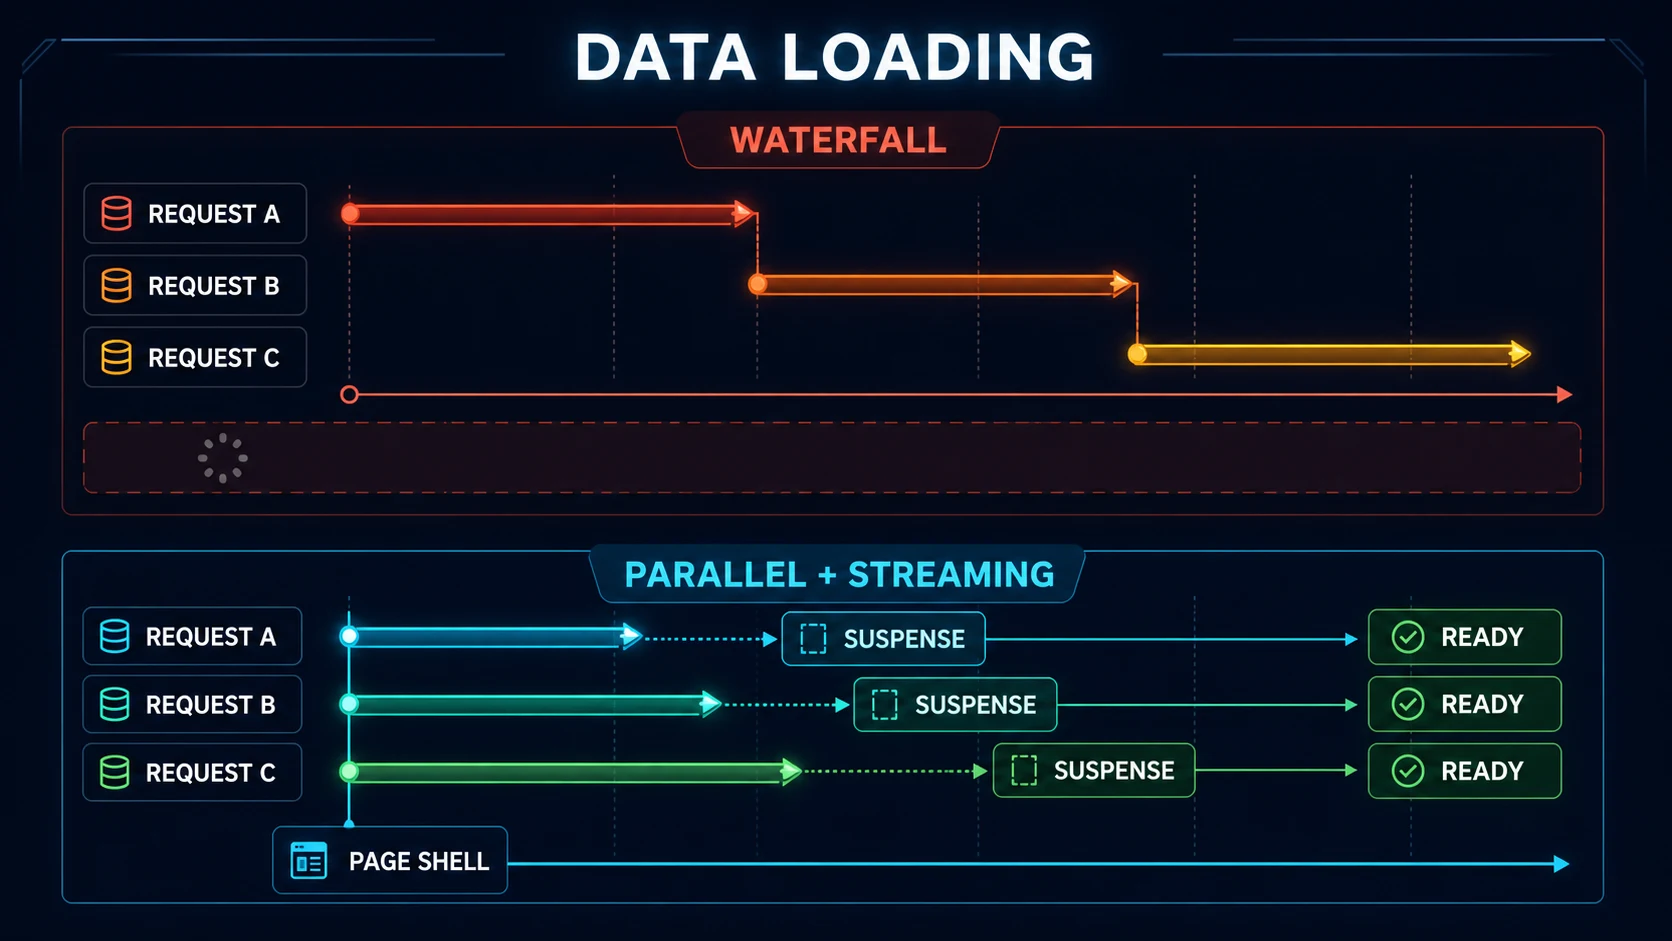
A waterfall happens when independent work waits unnecessarily. If account, activity, and summary queries do not depend on each other, start all three before awaiting their results. If the second query needs an ID from the first, that dependency is real; forcing it into Promise.all changes nothing.
export default async function DashboardPage() {
  const accountPromise = getAccount()
  const activityPromise = getRecentActivity()
  const summaryPromise = getSummary()

  const [account, activity, summary] = await Promise.all([
    accountPromise,
    activityPromise,
    summaryPromise,
  ])

  return <Dashboard account={account} activity={activity} summary={summary} />
}
Stream Useful UI with Suspense
A route-level loading.tsx automatically wraps its segment in Suspense and can show an immediate fallback during navigation. For a page with one slow region, place Suspense nearer that region so the heading, navigation, filters, and fast content can render first. Use a skeleton with stable dimensions and a meaningful label; do not replace an entire application shell with a spinner.
import { Suspense } from 'react'

export default function DashboardPage() {
  return (
    <main>
      <DashboardHeader />
      <QuickActions />
      <Suspense fallback={<RevenueSkeleton />}>
        <RevenuePanel />
      </Suspense>
    </main>
  )
}
Streaming improves delivery order and perceived progress; it does not make the underlying query faster. Optimize the backend too: select only used columns, paginate long results, create indexes that match real query filters and ordering, combine avoidable round trips, set timeouts, and call the database or service directly from Server Components instead of calling your own Route Handler over HTTP.
- Request
- Page shell
- Stable skeleton
- Slow data resolves
- Panel streams
Cache Only Safe, Reusable Work
In current App Router behavior, fetch is not cached by default. Next.js 16 Cache Components are enabled explicitly with cacheComponents: true; only then should examples use 'use cache' and cacheLife. Caching is valuable for expensive public catalog data or shared editorial content whose freshness policy is understood. It is dangerous when used as a reflex.
// next.config.ts
const nextConfig = { cacheComponents: true }
export default nextConfig

// lib/catalog.ts
import { cacheLife } from 'next/cache'

export async function getPublicCatalog() {
  'use cache'
  cacheLife('hours')
  return db.product.findMany({ where: { published: true } })
}
Never include personalized, tenant-specific, or permission-dependent results in a globally reusable cache. Authenticate and authorize at the protected data boundary, use an explicitly private and user-scoped design when appropriate, and do not treat a cache hit as proof of access. For tags, invalidation, and freshness strategies, read the full Next.js 16 caching guide.
Optimize Images, Fonts, and Layout Stability
Images are frequently the largest visible resource. Use next/image, provide width and height or a stable fill container, and write an accurate sizes value so the browser does not download a desktop image for a narrow card. Reserve priority for the actual above-the-fold LCP candidate; prioritizing many images competes for bandwidth. The complete image optimization guide covers remote sources, quality, responsive sizing, and common layout errors.
next/font self-hosts font files, removes an external font request, and helps avoid layout shifts. Prefer a variable font when it fits the design, request only needed subsets, and apply the generated class or variable from a shared layout. Do not load five families and every static weight for a page that uses two.
Control Third-Party Scripts
Analytics, chat, consent, video, maps, and A/B testing can dominate the main thread. Remove scripts whose business value is unknown, scope each remaining script to the page or layout that uses it, and choose the least aggressive strategy that still meets the requirement. With next/script, afterInteractive is the normal default, lazyOnload suits low-priority work, and beforeInteractive is reserved for rare critical site-wide scripts.
The experimental worker strategy is not supported in the App Router, so do not copy Pages Router examples blindly. A delayed script can still cause INP problems later; test actual interactions and failure behavior, including slow or blocked third-party origins.
Analyze the Bundle Before Removing Code
Do not guess which package is heavy. Build the application, inspect the client and server graphs for the affected route, and follow import chains. The current CLI exposes an experimental analyzer:
npm run build
npm start

# Current experimental route-aware analyzer
npx next experimental-analyze --output
# Report: .next/diagnostics/analyze
Look for a server-only package entering the client graph, a barrel export pulling many modules, duplicated libraries, large syntax highlighters, charting code on routes without charts, and locale data you do not use. Then move the import behind a server boundary, import a smaller entry point, dynamically load the feature, or replace the dependency. Rebuild and compare the same route.
Choose Rendering Per Route
Use static rendering when output can be reused safely, and dynamic rendering when the request genuinely depends on cookies, headers, authorization, or changing request-time data. Dynamic APIs such as cookies() and searchParams should be intentional and placed as low as practical in the route tree. Turning a whole layout dynamic for one leaf can increase server work across many pages.
Navigation performance also benefits from Link prefetching. Keep links discoverable as real links, avoid replacing standard navigation with unnecessary imperative routing, and verify behavior for large lists where uncontrolled prefetching could create excess work.
Practical Dashboard Optimization
Imagine an authenticated dashboard with a header, account summary, activity list, revenue chart, support widget, and avatar. The slow version marks the entire layout with 'use client', fetches its own API routes sequentially after hydration, imports the chart and support SDK immediately, ships an oversized avatar, and renders a blank spinner until every request resolves.
A measured redesign keeps the layout and page as Server Components. It verifies the session and calls the data layer directly, starts independent account, activity, and revenue requests together, renders the header and quick actions immediately, streams the slower revenue panel through Suspense, sends only minimal DTOs to a small filter Client Component, lazy-loads the interactive chart, uses a correctly sized image, and loads support chat after interaction or idle time.
| Observed cause | Focused change | Verify with |
|---|---|---|
| Large initial client graph | Move the client boundary to filters and chart controls | Route bundle and main-thread trace |
| Sequential server queries | Start independent reads together | Server timing or request trace |
| Blank page behind slow revenue data | Stream a stable panel skeleton | Response timeline and visual progress |
| Hero/avatar downloads too large | Correct dimensions, sizes, and responsive source | Network transfer and LCP resource |
| Support SDK blocks interaction | Scope and load it later | Long tasks and INP field data |
Production Testing and Performance Budgets
Run next build and next start before performance testing. Test cold and warm loads, mobile and desktop profiles, slow network and CPU conditions, anonymous and authenticated routes, navigation and direct URL entry, empty and large data sets, and third-party failure. Review server timing, CDN caching, database traces, browser network waterfalls, long tasks, memory, layout shifts, accessibility, and real-user vitals.
A performance budget should match the product and route rather than a copied universal number. Define the maximum initial JavaScript, image transfer, third-party cost, server response objective, and vital targets for a representative device class. Treat a regression in CI or monitoring as a conversation with evidence: what changed, which users are affected, and whether the value justifies the cost.
Common Performance Mistakes
- Testing only
next devor a fast desktop connection. - Chasing a score without reading the trace or checking field data.
- Adding
'use client'to a layout for one interactive control. - Fetching internal Route Handlers from Server Components.
- Awaiting independent requests one after another.
- Wrapping the entire page in one spinner instead of streaming useful regions.
- Assuming Suspense makes the database faster.
- Caching personalized data globally or without an explicit freshness policy.
- Lazy-loading primary content that users need immediately.
- Marking every image as priority or omitting an accurate
sizesvalue. - Loading unused font weights, global third-party scripts, or every feature library initially.
- Removing a dependency before tracing which route and import use it.
- Claiming a universal Lighthouse 100 result without reproducible conditions.
Next.js 16 Performance Checklist
- Record a production baseline for representative routes.
- Track LCP, INP, and CLS in both lab and real-user data.
- Keep Server Components as the default and client boundaries narrow.
- Start independent data requests in parallel and preserve true dependencies.
- Place Suspense around slow regions with stable, meaningful fallbacks.
- Optimize the database and external service calls behind streamed UI.
- Cache only reusable data with a documented audience and freshness policy.
- Use responsive images, self-hosted fonts, and scoped script strategies.
- Analyze route import chains and split optional Client Components.
- Choose static or dynamic rendering intentionally per route.
- Set route-specific budgets and detect regressions.
- Measure again under the same conditions and confirm with field data.
FAQ
How do I improve performance in Next.js 16?
Measure a production build, identify the limiting route or resource, fix the root cause, and measure again. Start with server-first rendering, narrow client boundaries, parallel data access, meaningful Suspense boundaries, optimized media, and controlled third-party scripts.
Are Server Components faster than Client Components?
Server Components do not add their component code to the browser JavaScript bundle, which can reduce download, parsing, and hydration work. Client Components remain appropriate for state, effects, event handlers, and browser APIs.
Does use client make every component in the app a Client Component?
No. It defines a client boundary for that module and the modules it imports. Keep the boundary close to the interactive leaf so most of the route remains server-rendered.
How do I remove data-fetching waterfalls?
Start independent requests before awaiting them and resolve them together with Promise.all, or move requests into sibling components that render in parallel. Keep truly dependent requests sequential.
Does Suspense make database queries faster?
No. Suspense can stream the page shell and completed regions earlier, improving perceived progress, but slow queries still need indexing, smaller results, fewer round trips, or an appropriate cache.
Should I cache every fetch in Next.js 16?
No. Cache only data that is safe to reuse for the intended audience and freshness window. Cache Components are opt-in, and personalized or permission-dependent data needs an explicitly private, user-scoped design.
How can I reduce the Next.js client bundle?
Keep Server Components as the default, move use client boundaries downward, dynamically import heavy Client Components and browser-only libraries, and inspect route import chains before removing or replacing dependencies.
How should I optimize images in the App Router?
Use next/image with correct intrinsic dimensions or fill plus sizes, responsive source sizing, modern formats, stable aspect ratios, and priority only for the actual above-the-fold LCP candidate.
Does next/font improve performance?
It self-hosts font files, removes a separate external font request, and helps prevent layout shift. Prefer a variable font when suitable and load only the subsets and weights the design uses.
When should I use next/dynamic?
Use it for heavy Client Components that are not required for the initial view. The ssr false option is only supported in Client Components and should be reserved for truly browser-only UI.
How do I measure Core Web Vitals in a Next.js app?
Use Lighthouse or browser tooling for repeatable lab diagnosis, then use real-user monitoring with useReportWebVitals or an analytics service to understand LCP, INP, and CLS across actual devices and networks.
Can Next.js guarantee a Lighthouse score of 100?
No. Scores depend on content, device, network, third parties, hosting, data sources, and test conditions. Set route-specific budgets and improve measured user outcomes instead of promising a universal score.
Official Resources
- Next.js: Production checklist
- Next.js: Lazy loading
- Next.js: Fetching data and streaming
- Next.js: Font optimization
- Next.js: Script optimization
- Next.js CLI and bundle analyzer
- Next.js: useReportWebVitals
Next Steps
You now have a repeatable way to improve App Router performance without relying on guesses: measure, diagnose, make one focused architectural or delivery change, and verify it. Continue with Blog #15: Next.js 16 Deployment Guide to deliver those optimizations safely through a production build, HTTPS, health checks, monitoring, and rollback.
