


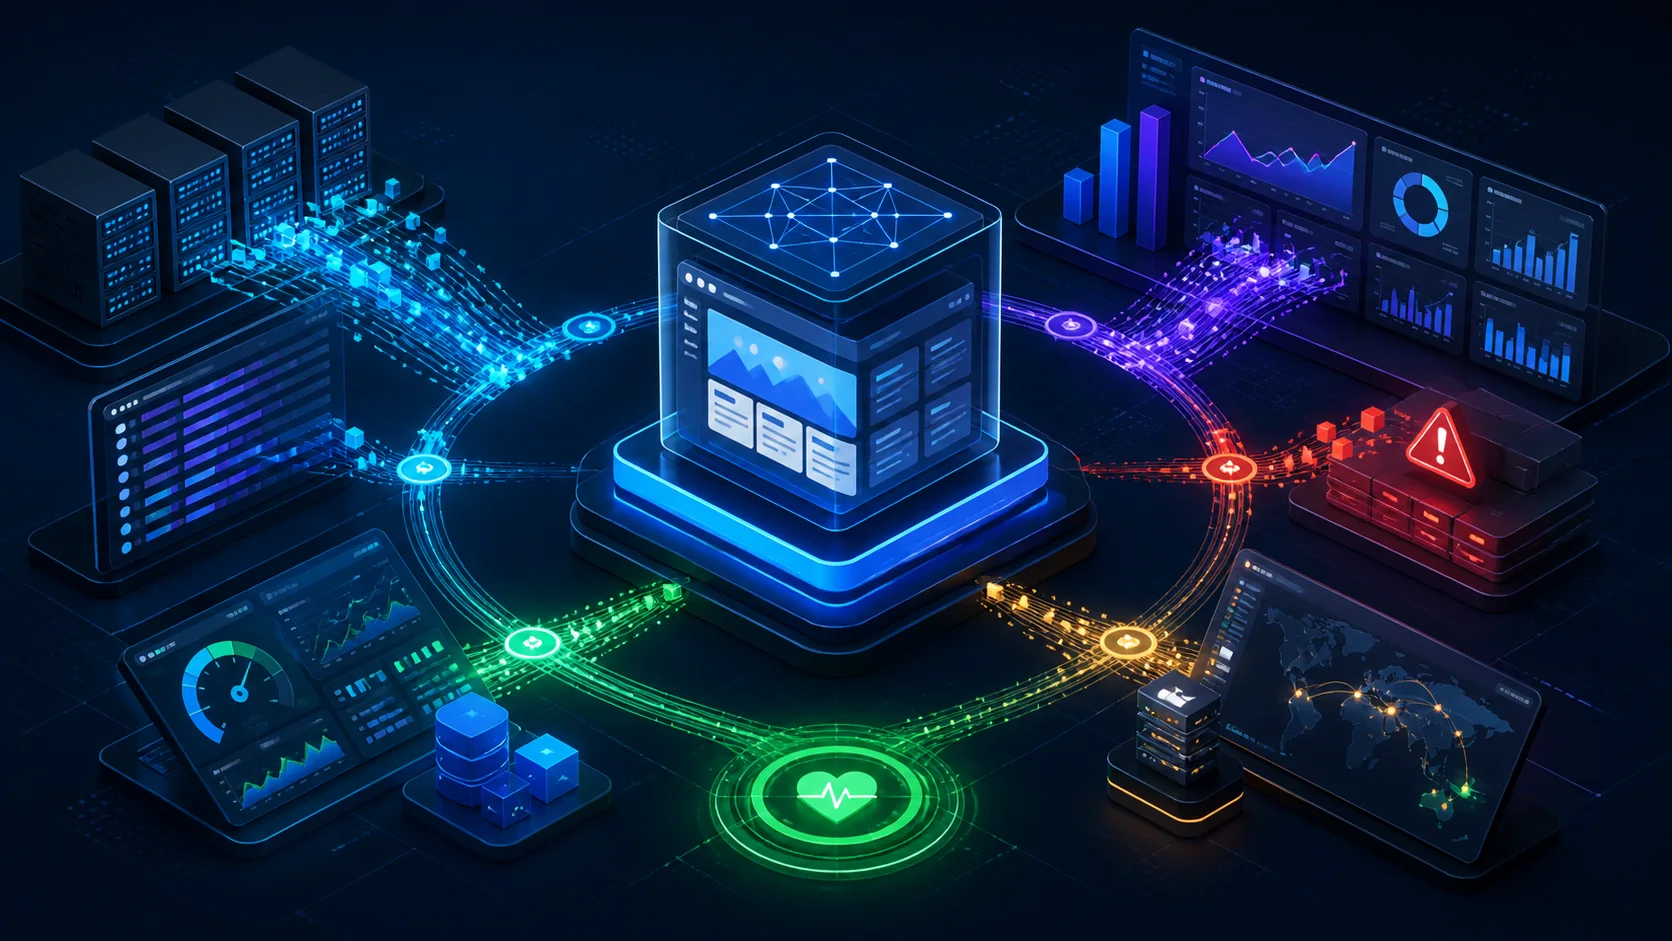
In Blog #23, we introduced workers and background jobs. Once a production system includes web requests, PostgreSQL, Redis, and independent workers, you need visibility into what it is doing when something becomes slow or fails. Next.js monitoring turns those runtime signals into evidence for diagnosis and safe response.
This publishing repository is PHP/Apache, not the example Next.js application. It has no Sentry, OpenTelemetry SDK, Prometheus, Grafana, Loki, Datadog, New Relic, structured server logger, collector, health service, Docker runtime, or production telemetry backend. The downloadable starter uses floating next: latest, so no exact patch version can be confirmed. This guide therefore shows provider-neutral educational patterns and does not install a second or imaginary monitoring stack.
- Blog #20Docker + TraefikPublished
- Blog #21Compose StackPublished
- Blog #22RedisPublished
- Blog #23Jobs + QueuesPublished
- Blog #24ObservabilityCurrent
What Is Observability in Next.js?
Observability in Next.js is the ability to understand production behavior from correlated logs, metrics, traces, errors, health checks, and user-experience data. It helps operators answer what failed, where it failed, which users or services were affected, and whether a deployment, dependency, or traffic change caused the problem.
Monitoring vs Observability
Monitoring
Tracks uptime, error rate, latency, capacity, certificate expiry, queue age, and defined service objectives. It answers whether a known boundary has been crossed.
Observability
Connects evidence for investigation. It explains why a route, release, tenant class, database call, or worker became unhealthy—even when nobody predicted that exact failure.
Neither means “collect everything forever.” A useful system captures signals tied to decisions, limits cardinality and retention, removes private data, and assigns an owner to every alert.
Logs, Metrics, Traces, and Errors
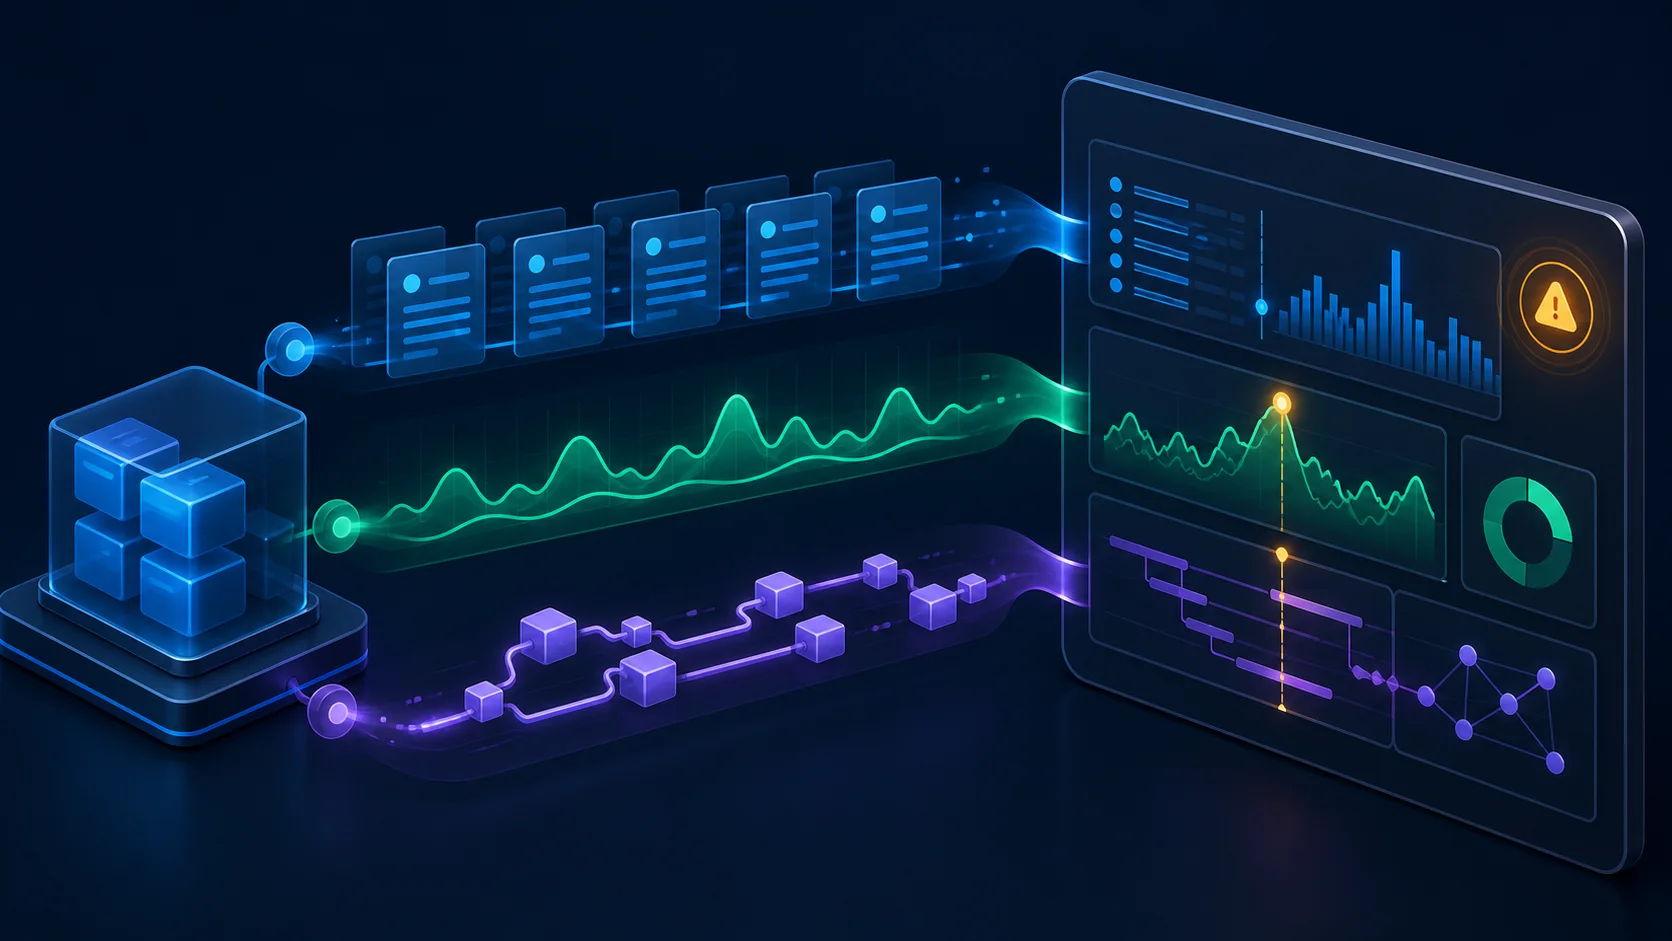
Logs record discrete events. Metrics aggregate measurements over time. Traces follow work across boundaries using spans. Error monitoring groups exceptions with release and runtime context. They become substantially more useful when they share stable service, environment, deployment, trace, and request identifiers.
Structured Logging
Production logs should be machine-readable events, not sentences assembled from user input. A stable JSON schema makes filtering and alerting predictable. Use UTC timestamps, normalized levels, event names, route templates rather than raw URLs, numeric duration, safe error categories, deployment version, service name, and correlation IDs.
type LogLevel = 'info' | 'warn' | 'error'
type SafeLog = {
  level: LogLevel
  event: string
  requestId?: string
  traceId?: string
  route?: string
  method?: string
  status?: number
  durationMs?: number
  errorType?: string
}

export function writeLog(entry: SafeLog) {
  const record = { timestamp: new Date().toISOString(), service: 'web', ...entry }
  const line = JSON.stringify(record)
  if (entry.level === 'error') console.error(line)
  else if (entry.level === 'warn') console.warn(line)
  else console.info(line)
}
This wrapper is intentionally small and not a substitute for a reviewed logger. If the real project already uses Pino, Winston, a platform logger, or an error provider, extend that system instead of creating a competing pipeline.
Useful fields
- Stable event and service names
- Environment and immutable release ID
- Request, trace, job, and safe account references
- Route template, status, and duration
- Dependency name and safe error category
Never log
- Passwords, cookies, or authorization headers
- Access, refresh, reset, or verification tokens
- Database or Redis connection strings
- Complete request bodies or private documents
- Provider credentials and raw sensitive errors
Logging Server Components, Actions, and Routes
Server Components can log unexpected data-source failures, but avoid logging during every render because caching, revalidation, pre-rendering, and retries can produce surprising volume. Server Actions should log safe mutation outcomes after authentication, authorization, and validation—not submitted secrets. Route Handlers are natural places to measure status and latency, but raw URL query strings may contain private data.
export async function POST(request: Request) {
  const startedAt = performance.now()
  const requestId = crypto.randomUUID()
  let status = 500

  try {
    const response = await handleAuthorizedRequest(request, requestId)
    status = response.status
    return response
  } catch (error) {
    writeLog({ level: 'error', event: 'api.unexpected_error', requestId,
      route: '/api/reports', method: 'POST', errorType: getSafeErrorType(error) })
    throw error
  } finally {
    writeLog({ level: 'info', event: 'api.completed', requestId,
      route: '/api/reports', method: 'POST', status,
      durationMs: Math.round(performance.now() - startedAt) })
  }
}
Expected and Unexpected Errors
Expected failures—invalid input, denied access, conflict, or a known provider rejection—should become deliberate safe responses and low-noise business metrics. Unexpected exceptions should reach the nearest Next.js error boundary or server error hook and the approved error provider. Do not report every 404 or validation issue as a production incident.
Request IDs and Correlation IDs
A request ID identifies one inbound request. A trace ID connects spans across services. A job ID follows asynchronous work. Generate or accept identifiers only at a trusted boundary, validate their format and length, and do not use a user ID as a metric label. Propagate correlation context to supported HTTP clients, database instrumentation, and jobs without treating it as authorization.
Next.js 16 Instrumentation
Current Next.js uses a root-level instrumentation.ts, or the corresponding location inside src. Its register function runs once when a server instance starts and must finish before requests are served. Because registration runs across runtimes, conditionally import Node- or Edge-specific packages. The optional onRequestError hook reports server errors and must await asynchronous provider work.
import type { Instrumentation } from 'next'

export async function register() {
  if (process.env.NEXT_RUNTIME === 'nodejs') {
    await import('./instrumentation-node')
  }
}

export const onRequestError: Instrumentation.onRequestError = async (
  error, _request, context,
) => {
  await reportServerError({
    error,
    routeType: context.routeType,
    routePath: context.routePath,
  })
}
Do not log request headers or bodies from this global hook. Provider failure must not recursively crash error handling. Keep initialization deterministic, runtime-compatible, and fast.
OpenTelemetry with Next.js
OpenTelemetry is a vendor-neutral framework for producing, collecting, processing, and exporting telemetry. An SDK instruments the application, context propagation connects spans, and an exporter sends data—often with OTLP—to an OpenTelemetry Collector. The collector can batch, filter, redact, enrich, and route signals to approved backends. OpenTelemetry is not a dashboard or storage system by itself.
import { registerOTel } from '@vercel/otel'

export function register() {
  registerOTel('next-app')
}
The repository does not contain @vercel/otel, so this is not installed here. A real rollout must pin compatible packages, configure exporters and sampling, test Node versus Edge behavior, protect the collector endpoint, and measure telemetry overhead.
Traces and Spans
A trace describes one end-to-end operation; spans represent timed units such as a Route Handler, database query, Redis command, queue wait, worker task, or provider call. Add custom spans only around meaningful boundaries that automatic instrumentation cannot explain. Avoid attributes containing raw URLs, SQL text, user IDs, email addresses, prompt contents, or unbounded values.
API Metrics and Cardinality
Measure request count, error count, and duration distributions by bounded attributes such as service, method, normalized route template, status class, region, and release. Use histograms for latency rather than averaging individual observations. User IDs, request IDs, raw paths, search strings, and error messages are high-cardinality labels that can exhaust memory and cost.
Core Web Vitals and Client Monitoring
Server health does not guarantee a fast user experience. Current Next.js supports useReportWebVitals in a small Client Component. Send LCP, CLS, INP, and supporting measurements to an approved internal endpoint or provider. Analyze field distributions by bounded page group, device class, and release; do not attach private URLs or identities.
'use client'
import { useReportWebVitals } from 'next/web-vitals'

export function WebVitals() {
  useReportWebVitals((metric) => {
    const body = JSON.stringify({
      name: metric.name, value: metric.value, rating: metric.rating,
      id: metric.id, navigationType: metric.navigationType,
    })
    navigator.sendBeacon('/api/telemetry/web-vitals', body)
  })
  return null
}
The receiving route must enforce content type, body size, schema, origin policy, rate controls, and retention. Browser telemetry is untrusted input. Keep instrumentation-client.ts lightweight because it executes before hydration and can initialize approved early error or navigation monitoring.
Health Checks: Liveness and Readiness
Liveness asks whether the process should be restarted. Readiness asks whether it should receive traffic. A liveness endpoint should be cheap and independent of remote services. Readiness may check only critical dependencies with strict timeouts and a small concurrency budget. Never expose versions, environment variables, hostnames, database details, or exception messages.
export const dynamic = 'force-dynamic'
export function GET() {
  return Response.json(
    { status: 'ok' },
    { headers: { 'Cache-Control': 'no-store' } },
  )
}export async function GET() {
const ready = await checkCriticalDependencies({ timeoutMs: 750 })
return Response.json(
{ status: ready ? 'ready' : 'unavailable' },
{ status: ready ? 200 : 503, headers: { 'Cache-Control': 'no-store' } },
)
}Uptime and Synthetic Monitoring
An external probe should test DNS, TLS, routing, and a safe user-visible path from more than one location. A health endpoint alone can be green while login, checkout, asset delivery, or a regional dependency is broken. Keep synthetic accounts scoped, rotate credentials, prevent test activity from affecting analytics, and alert on sustained failures rather than one transient sample.
Docker, Traefik, PostgreSQL, and Redis
Docker and host
Track CPU throttling, memory working set and OOM kills, disk and inode pressure, network errors, file descriptors, restarts, health transitions, image release, and deployment events.
Traefik
Observe request rate, status classes, duration, upstream failures, retries, TLS certificate expiry, router/service labels, and access logs with query strings and sensitive headers removed.
PostgreSQL
Monitor availability, connection pool usage, query latency, locks, deadlocks, long transactions, replication and backup health, disk growth, and cache behavior. Do not log raw parameters or unrestricted SQL.
Redis
Monitor command latency, memory, fragmentation, evictions, expired keys, connections, blocked clients, persistence, replication, errors, cache usefulness, and queue-specific depth and age.
Background Worker and Queue Monitoring
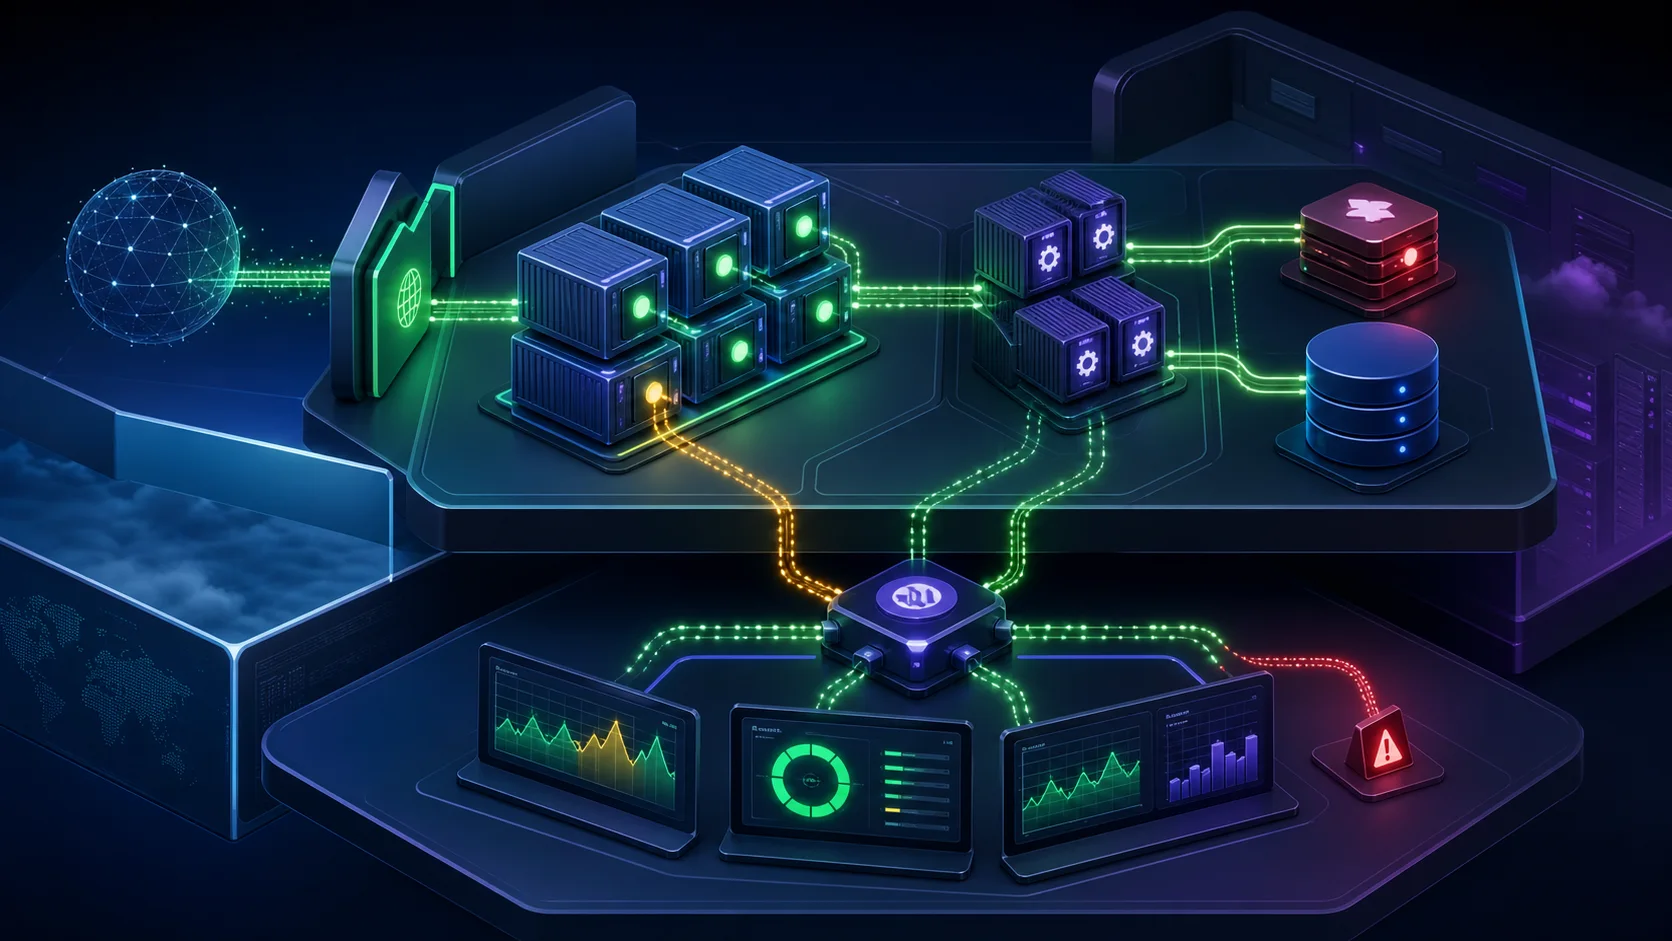
The queue architecture from Blog #23 needs process and business signals. Track queue depth, oldest waiting age, arrival and completion rates, active concurrency, duration percentiles, retries, exhausted jobs, stalled jobs, scheduled-job lag, worker restarts, graceful shutdown duration, Redis connections, provider limits, and successful business outcomes.
Alerts and Service Objectives
Alert on user impact and sustained risk, not every exception. Start with availability, error ratio, latency, queue age, resource exhaustion, critical dependency failures, certificate expiry, backup failure, and failed deployment health. Combine symptoms when possible, add a duration window, route to an owned destination, and attach a runbook and dashboard link.
| Signal | Useful alert | Avoid |
|---|---|---|
| Availability | Sustained failed external probes | One isolated timeout |
| Errors | Error ratio above objective with traffic | Every expected 4xx |
| Latency | High percentile exceeds objective | Average latency alone |
| Queue | Oldest job age grows beyond promise | Depth without arrival context |
| Capacity | Sustained saturation and user impact | One CPU spike |
Dashboards That Answer Questions
A useful overview shows traffic, availability, error rate, latency percentiles, saturation, active release, and deploy events. Add focused dashboards for routes, workers, PostgreSQL, Redis, Web Vitals, and business outcomes. Every chart needs units, scope, aggregation, timezone, and a reason to exist. A wall of unrelated graphs is not observability.
Production Incident Workflow
- Confirm user impact and incident scope.
- Assign an incident owner and communication channel.
- Check recent deployments and configuration changes.
- Use overview metrics to locate the failing service or dependency.
- Follow a trace and correlated logs without exposing private data.
- Mitigate safely: rollback, disable a feature, reduce admission, or restore capacity.
- Verify recovery through user-facing and business signals.
- Preserve a timeline and write corrective actions with owners.
Common Monitoring Mistakes
Logging everything
Volume, cost, and privacy risk rise while useful events disappear in noise.
Secrets in telemetry
Logs, traces, errors, replays, and dashboards must be treated as sensitive systems.
High-cardinality metrics
User, request, and raw URL labels create unbounded time series.
Average-only latency
Averages hide slow-tail users; inspect distributions and percentiles.
Health check overload
Heavy dependency checks can create the outage they are supposed to detect.
Alerting every error
Noise trains responders to ignore real incidents. Alert on sustained impact.
No release correlation
Without immutable deployment identity, regressions are harder to isolate and roll back.
Dashboard without owner
Signals do not improve reliability unless someone responds and updates the system.
Next.js Monitoring Best Practices
- Start from user journeys and service objectives.
- Reuse the approved logger and monitoring provider.
- Emit structured events with stable names and units.
- Redact at collection and application boundaries.
- Correlate logs, traces, errors, jobs, and releases.
- Use bounded metric dimensions.
- Measure distributions and high percentiles.
- Keep instrumentation runtime-aware and lightweight.
- Separate liveness from readiness.
- Monitor external uptime and real-user experience.
- Observe workers, PostgreSQL, Redis, proxy, and host.
- Sample traces intentionally and review cost.
- Attach alerts to owners and tested runbooks.
- Record deploy events and rollback evidence.
- Test telemetry failure and incident procedures.
Related Next.js Tutorials
- Blog #9: Error Handling for expected and unexpected failure boundaries.
- Blog #10: Route Handlers for health and telemetry endpoints.
- Blog #14: Performance for measurement-first optimization and Web Vitals.
- Blog #16: Environment Security for protecting provider credentials.
- Blog #20: Docker + Traefik for the production edge and release lifecycle.
- Blog #21: Docker Compose for private service architecture.
- Blog #22: Redis for Redis-specific operational signals.
- Blog #23: Background Jobs for worker and queue reliability.
Frequently Asked Questions
What is Next.js monitoring?
Next.js monitoring collects safe production signals about availability, errors, latency, traffic, resource use, and user experience so operators can detect and diagnose problems.
What is observability in Next.js?
Observability is the ability to understand a Next.js system from its logs, metrics, traces, errors, health checks, and correlated infrastructure signals.
What is the difference between monitoring and observability?
Monitoring checks known conditions and thresholds. Observability provides enough correlated context to investigate both known and unexpected behavior.
Does Next.js support OpenTelemetry?
Yes. Next.js provides instrumentation hooks and OpenTelemetry guidance. The exact SDK, exporter, runtime support, sampling, and provider setup must match the deployed application.
Where does instrumentation.ts go in Next.js 16?
Place instrumentation.ts at the project root, or inside src when the app and pages directories are also under src. It is not placed inside app.
What does onRequestError do?
The optional onRequestError export receives server errors captured by Next.js so an application can await reporting to its selected monitoring provider.
How should I log Next.js requests?
Emit structured server logs with timestamp, level, event name, route template, method, status, duration, deployment version, and correlation identifiers while excluding secrets and private payloads.
What should never appear in production logs?
Never log passwords, cookies, authorization headers, access tokens, private keys, connection URLs, raw personal data, or complete sensitive request bodies.
How do I measure Core Web Vitals in Next.js?
Use a small Client Component with useReportWebVitals and send bounded metrics to an internal analytics endpoint or an approved monitoring provider.
What is a Next.js health check?
A health check is a narrow endpoint used by load balancers or orchestrators to determine whether the process is alive or ready for traffic without exposing internal details.
What is the difference between liveness and readiness?
Liveness indicates whether the process should be restarted. Readiness indicates whether it should currently receive traffic and may include strictly timed critical dependency checks.
Should health checks query the database?
A readiness check may perform a lightweight, tightly timed critical dependency check. Liveness normally should not depend on Redis, PostgreSQL, or external providers.
How do I monitor background workers?
Track process health, active concurrency, queue depth and age, throughput, duration, retries, stalled and failed jobs, dependency errors, and graceful shutdowns.
What alerts should a Next.js application have?
Start with user-impacting availability, sustained error rate, latency, queue age, dependency saturation, resource exhaustion, and failed deployment alerts tied to an owned response procedure.
Do I need Prometheus, Grafana, or Sentry?
Not automatically. Reuse the approved platform and add tools only after defining required signals, ownership, data handling, retention, cost, and operational responsibilities.
Current Official References
- Next.js instrumentation guide
- Next.js instrumentation file convention
- Next.js client instrumentation
- Next.js analytics and Web Vitals
- Next.js OpenTelemetry guide
- OpenTelemetry signals
- OpenTelemetry components and Collector
- OpenTelemetry metrics and cardinality
Next Steps
You now have a production observability model spanning Next.js requests, client performance, workers, queues, PostgreSQL, Redis, containers, and the public edge. Start with the system that already exists, define user-facing objectives, and add the smallest set of correlated signals that supports safe action.
